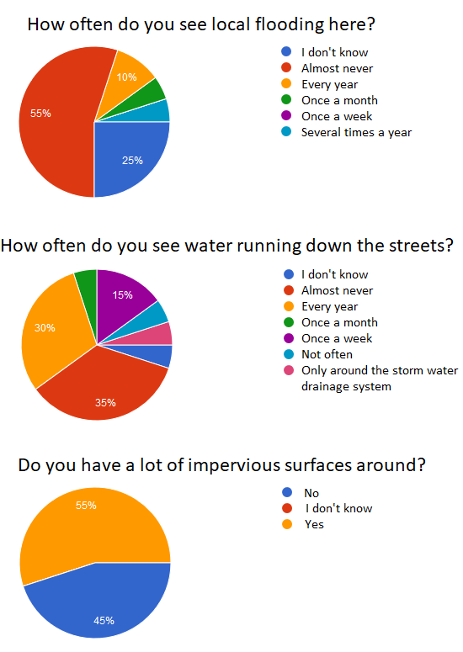
The first series of hydrological questionnaires were also conducted this summer. We have checked northern Poland for now, but we are constantly expanding the area. It turns out that it rains on average once a week, most often it rains for one hour and it’s a drizzle. The flood situation does not look bad, but the “measurements” were carried out in a less urbanized area (80% answers from places with a lot of green areas).
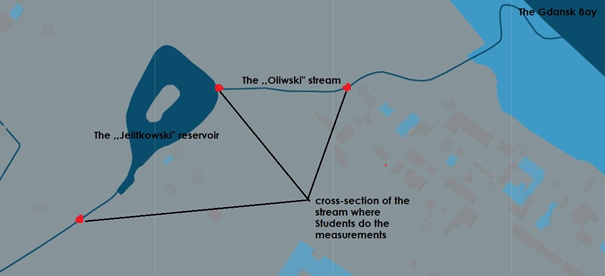
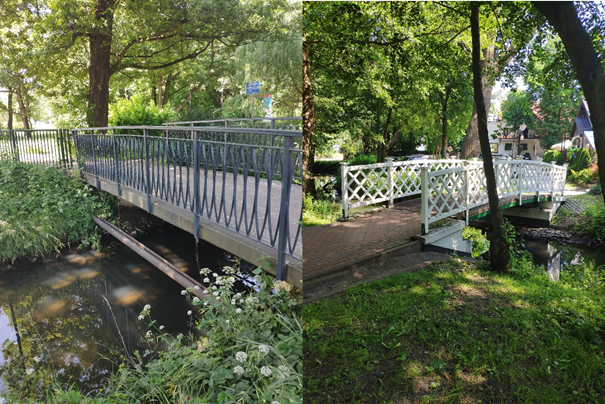
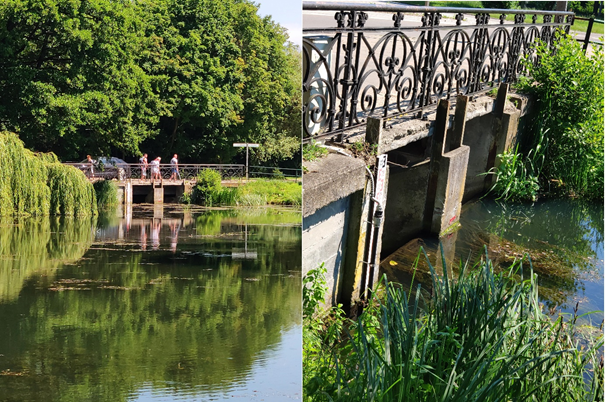
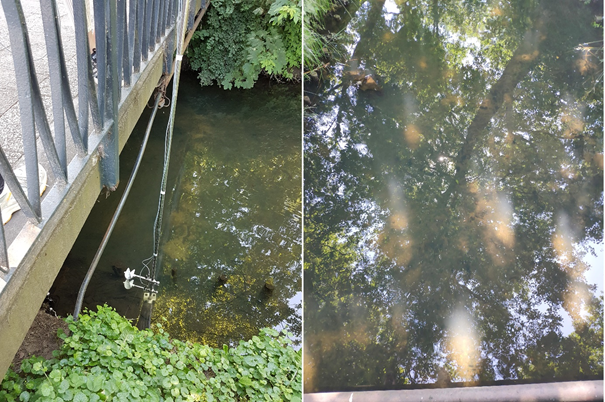
The measurements took place in June in Gdańsk in the Jelitkowo district at the mouth of the Gdańsk Bay. In the area of measurements were located the Jelitkowska reservoir and Oliwski stream. During the measurements, the students performed bottom sounding in two cross-sections of the stream, measurement of the flow velocity with the use of hydrometric mills in these cross-sections, and measurement of surface velocity using floats and a stopwatch. Moreover, in order to determine the longitudinal slope of the water level, height measurements were made with a technical level. In addition, in one of the cross-sections located at the outflow from the reservoir, measurements of the load of the overflow with a sharp edge were made.
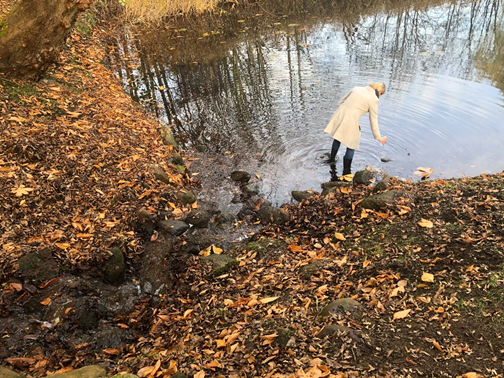
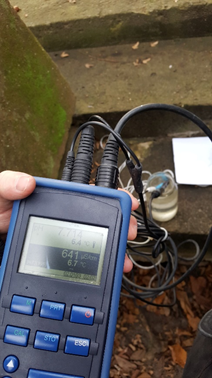
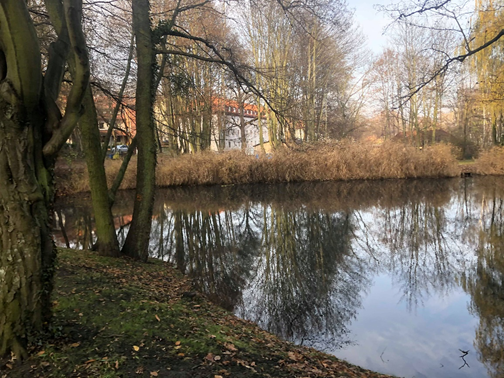
The student technical trip took place in Krolewski Park in Gdansk. Students measured basic parameters of water as temperature, pH, conductivity with simple measurement tools. Parameters as odor, smell, color, turbidity, suspended solids, and concentration of dissolved oxygen (after addition of chemical reagents) were measured only organoleptic. Water quality was assessed as quite good and satisfactory. The performed exercise aimed to verify the ability to evaluate water quality by residents and stakeholders with no technical education.
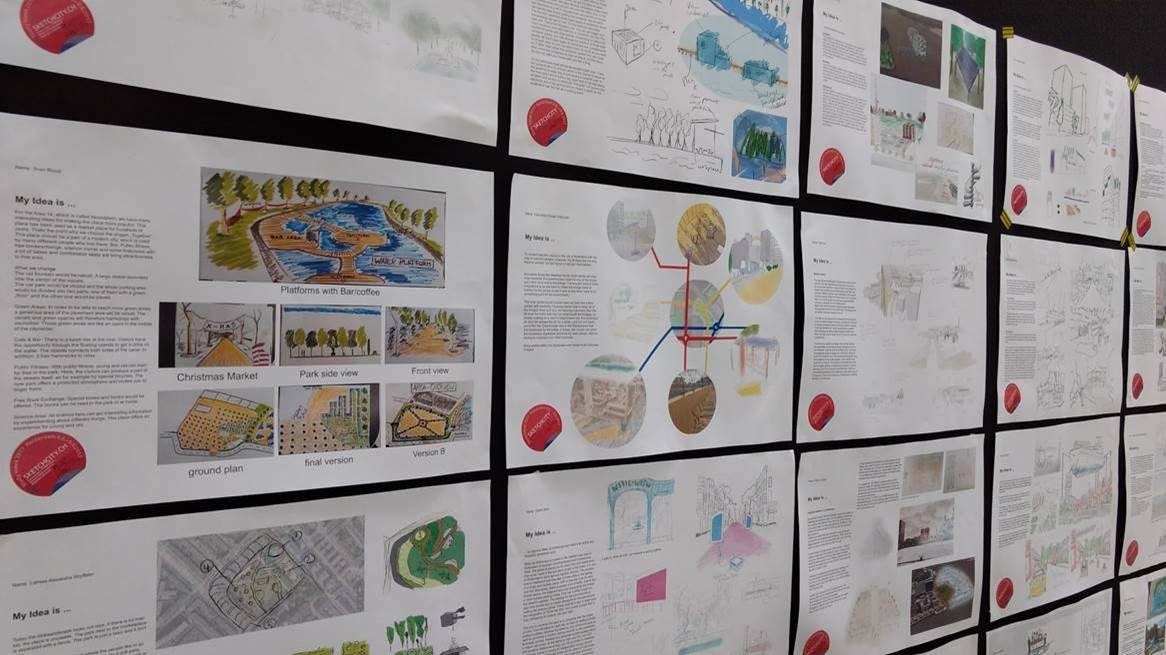
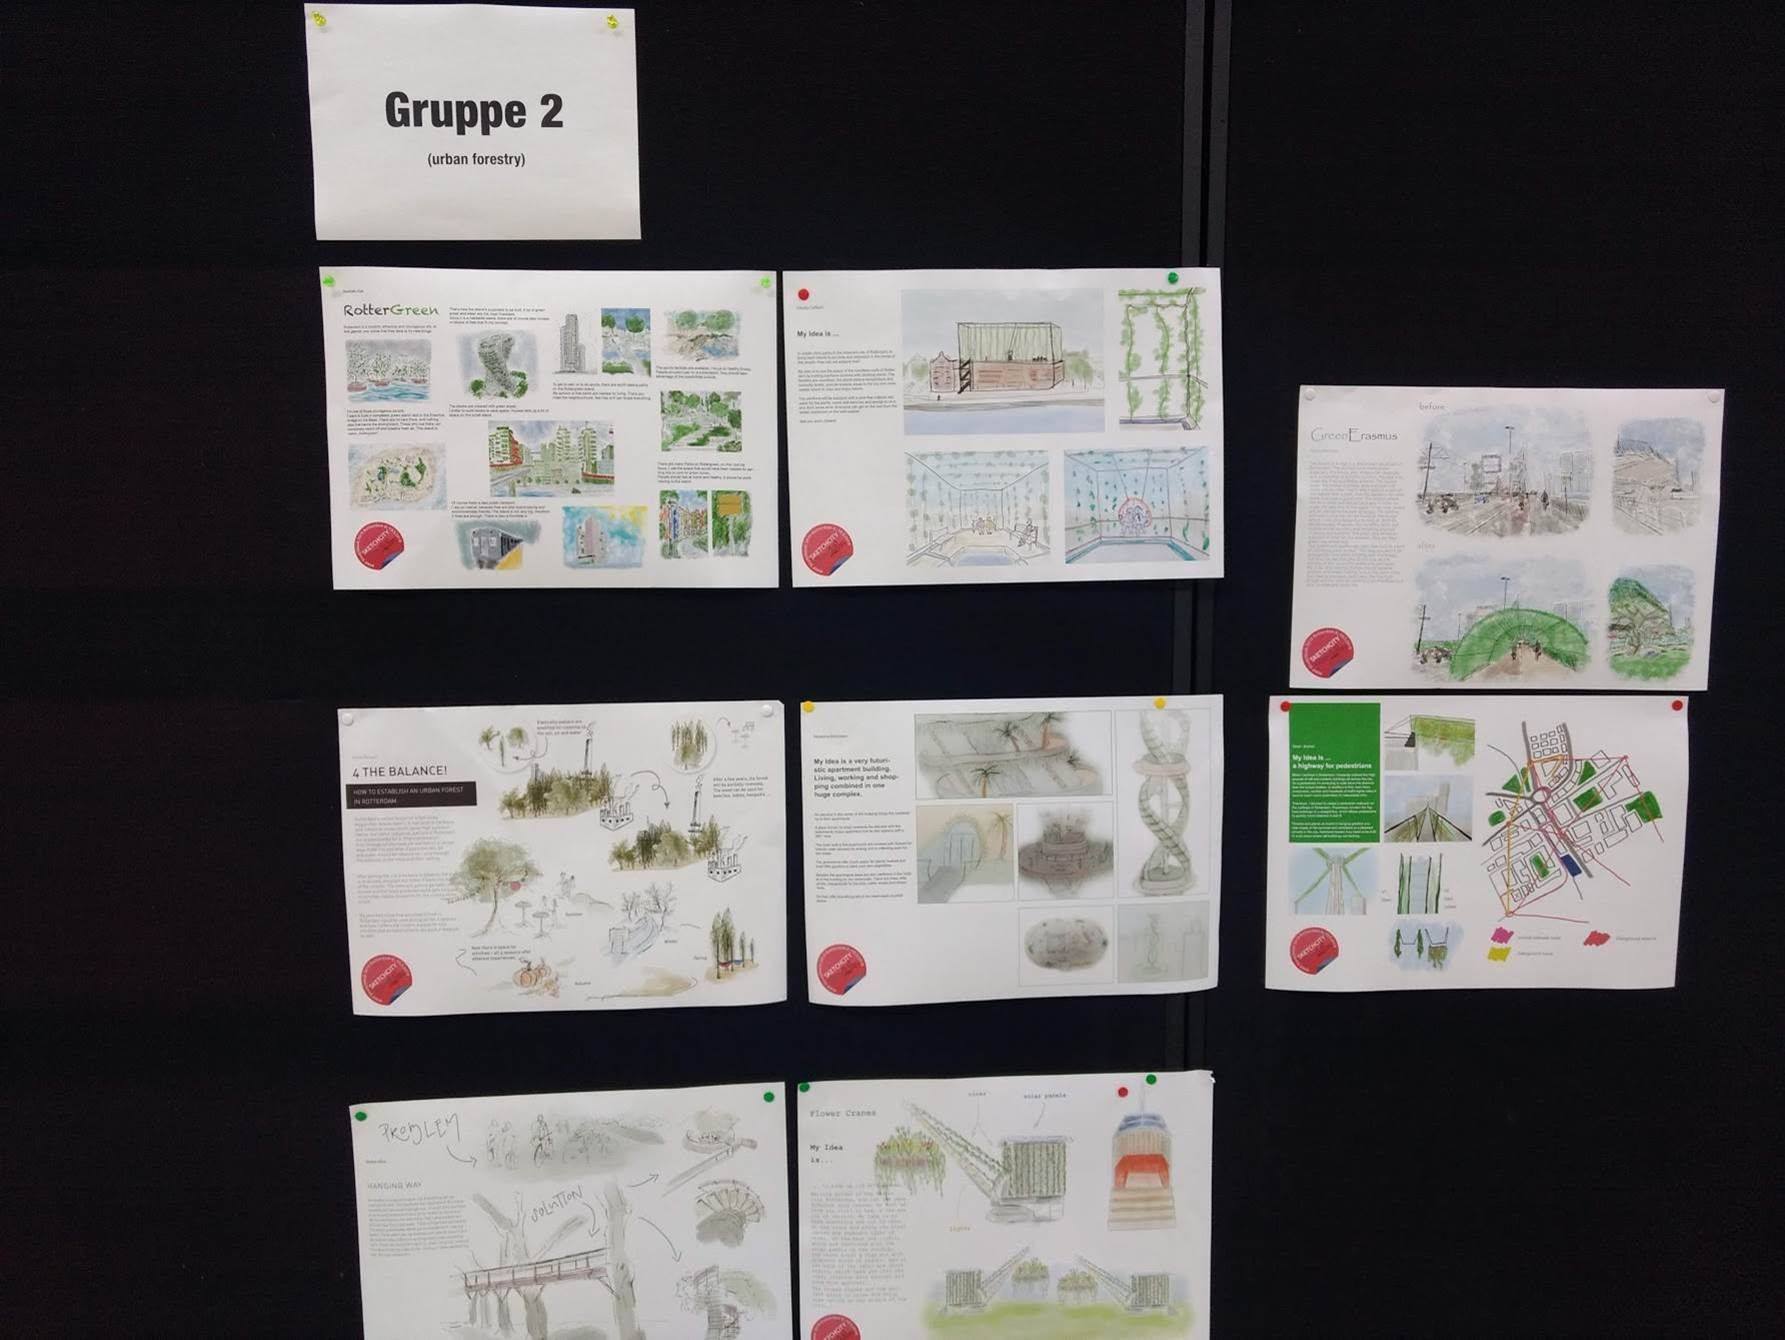
Through visual idea design, diverse urban needs in a city can be made visible and thus flow directly into the complex urban development and its planning. The spectrum ranges from „good ideas“ to comprehensive portfolios with concrete solutions. Citizens should thus be included in the planning processes and the diverse approaches to solutions coordinated by online systems, made transparently and access to influential data material supported. This is exactly where Sketch&Draw comes in: the urban population or those directly affected by specific urban development processes sketch out imaginative solutions and planning criteria. The sketch of an idea can outline the future and the necessary images of a possible future and thus support innovative solutions. In the best case, it can even create a future-relevant design or concrete solutions for complex problems. In European cities, the threats of climate change are crucial for urban development and human security. Although cities are increasingly experiencing new approaches to local adaptation planning, there are still significant barriers and limits, such as:
Limited availability of up-to-date data on local conditions.
Lack of awareness and civic attitudes of ignorance of climate change and its impact on basic well-being and local conditions in our streets and neighbourhoods, lack of public interest, and finally:
The lack of interdisciplinary approaches and public action to solve local problems, and often the inability to choose optimal solutions from a set of alternative measures.
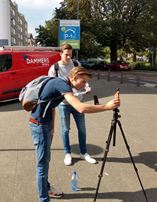
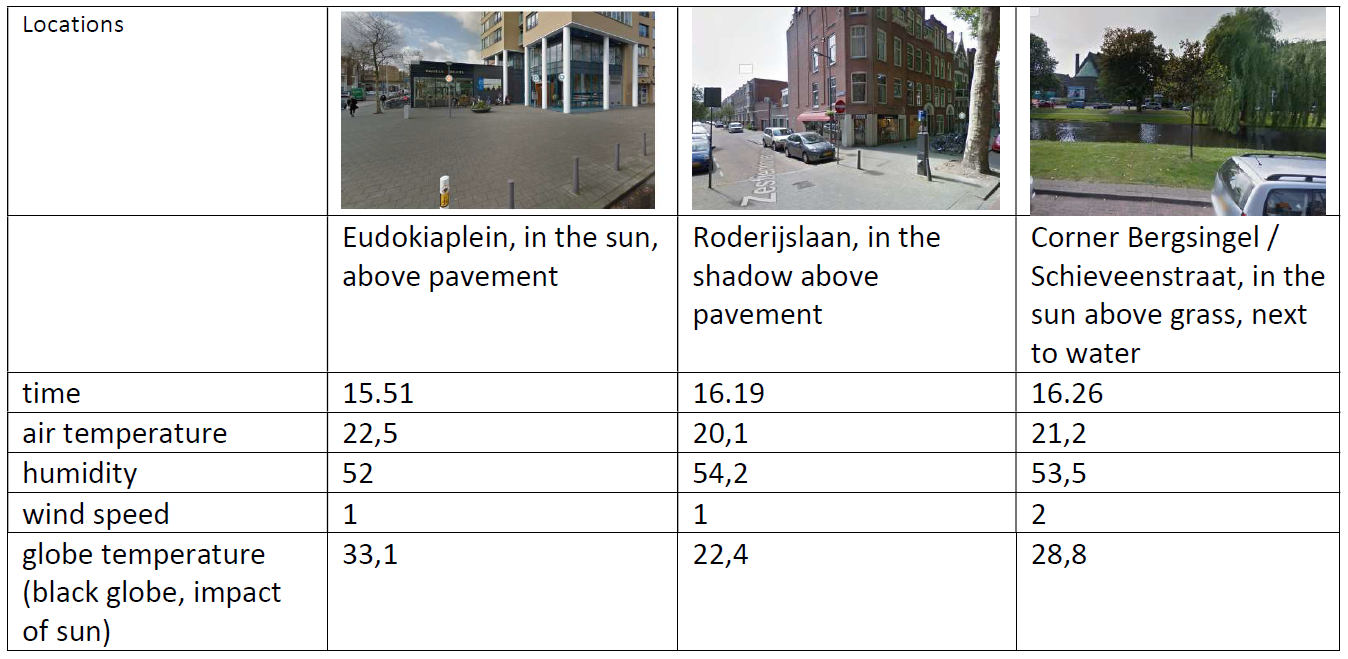
During the introduction week at Rotterdam University of Applied Sciences with students Watermanagement, we tested the Kestrel heat measurement tools for the IMPETUS project. We assessed the thermal experience of pedestrians moving through the Liskwartier district in Rotterdam. Thermal walks can answer their questions such as: How hot is a shopping street, a residential area, a specific walking route through the city, or a station area? Which adjustments are needed to create cool spaces? Which factors determine whether the outdoor space is hot or cool and which of these factors can be included in a heat-resilient design? The first week of September was not as hot as it was this summer period, but we were able to measure the thermal situation at four different locations: in a paved urban square, in a shady park, in a green park in the sun, under a street tree, and in a paved sunlit urban street environment. During a thermal walk, the participants of the walk visit several locations in a specific area and investigate the thermal situation at these locations based on meteorological measurements and questionnaires. We measured air temperature, humidity, and wind speed. The impact of the sun on a black globe resulted in the globe temperature, the effect of the wind resulted in the chill factor temperature, the inclusion of the humidity resulted in HEAT index, and the Wet Bulb Globe Temperature could be measured, although this is applicable mainly in very hot or cold extremes. Besides the measurements, several questions were answered about the perception of the heat at that particular location.
A group of 1st-year students of Watermanagement, sampled a riverbank in Rotterdam for plastic litter. This was done for the development of a measurement method for riverine plastics in urban environments. A methodology based on Ospar was tested to validate the sampling technique. This method consists of sampling random square meters along a riverbank. The goal is to develop a valid, easy, and quick process to determine the amount and composition of plastic riverine litter. During two days, students measured a total grid of 5 x 10 meters. The data collected can be used as reference data for randomized sampling. Students of the Minor Smart Water will collect randomized data in the coming months and compare this to reference data collected in march 2020 and September 2020. This way the ‘random stratified Ospar methodology’ can be validated, and recommendations will be given for further optimization. Of course, the students also cleaned the river bank and contributed to a cleaner environment!
Dear Students, Due to COVID-19, the Climate Scan Rotterdam Activity C1 – “Intensive programs for higher education” (planned April 20th – 24th 2020) has been postponed and is now preliminarily scheduled for September 2020.
On 10.12.2019 a small group met in Amsterdam for a technical meeting to discuss possibilities for the planned software and the game which will be developed during the project.
A time-laps of this meeting can be seen here and on Youtube: https://youtu.be/jqt7zgxwDg4